Statistics
The Statistics section gives you deep insights into your support operations. Track conversation volumes, identify peak times, monitor issue trends, and measure team performance — all in one place.
Access Statistics from the left sidebar under the Statistics menu, which expands to show:
- Conversations
- Reported Issues
- Peak Times
- Campaigns
- Revenue
- SLA
Conversations Statistics
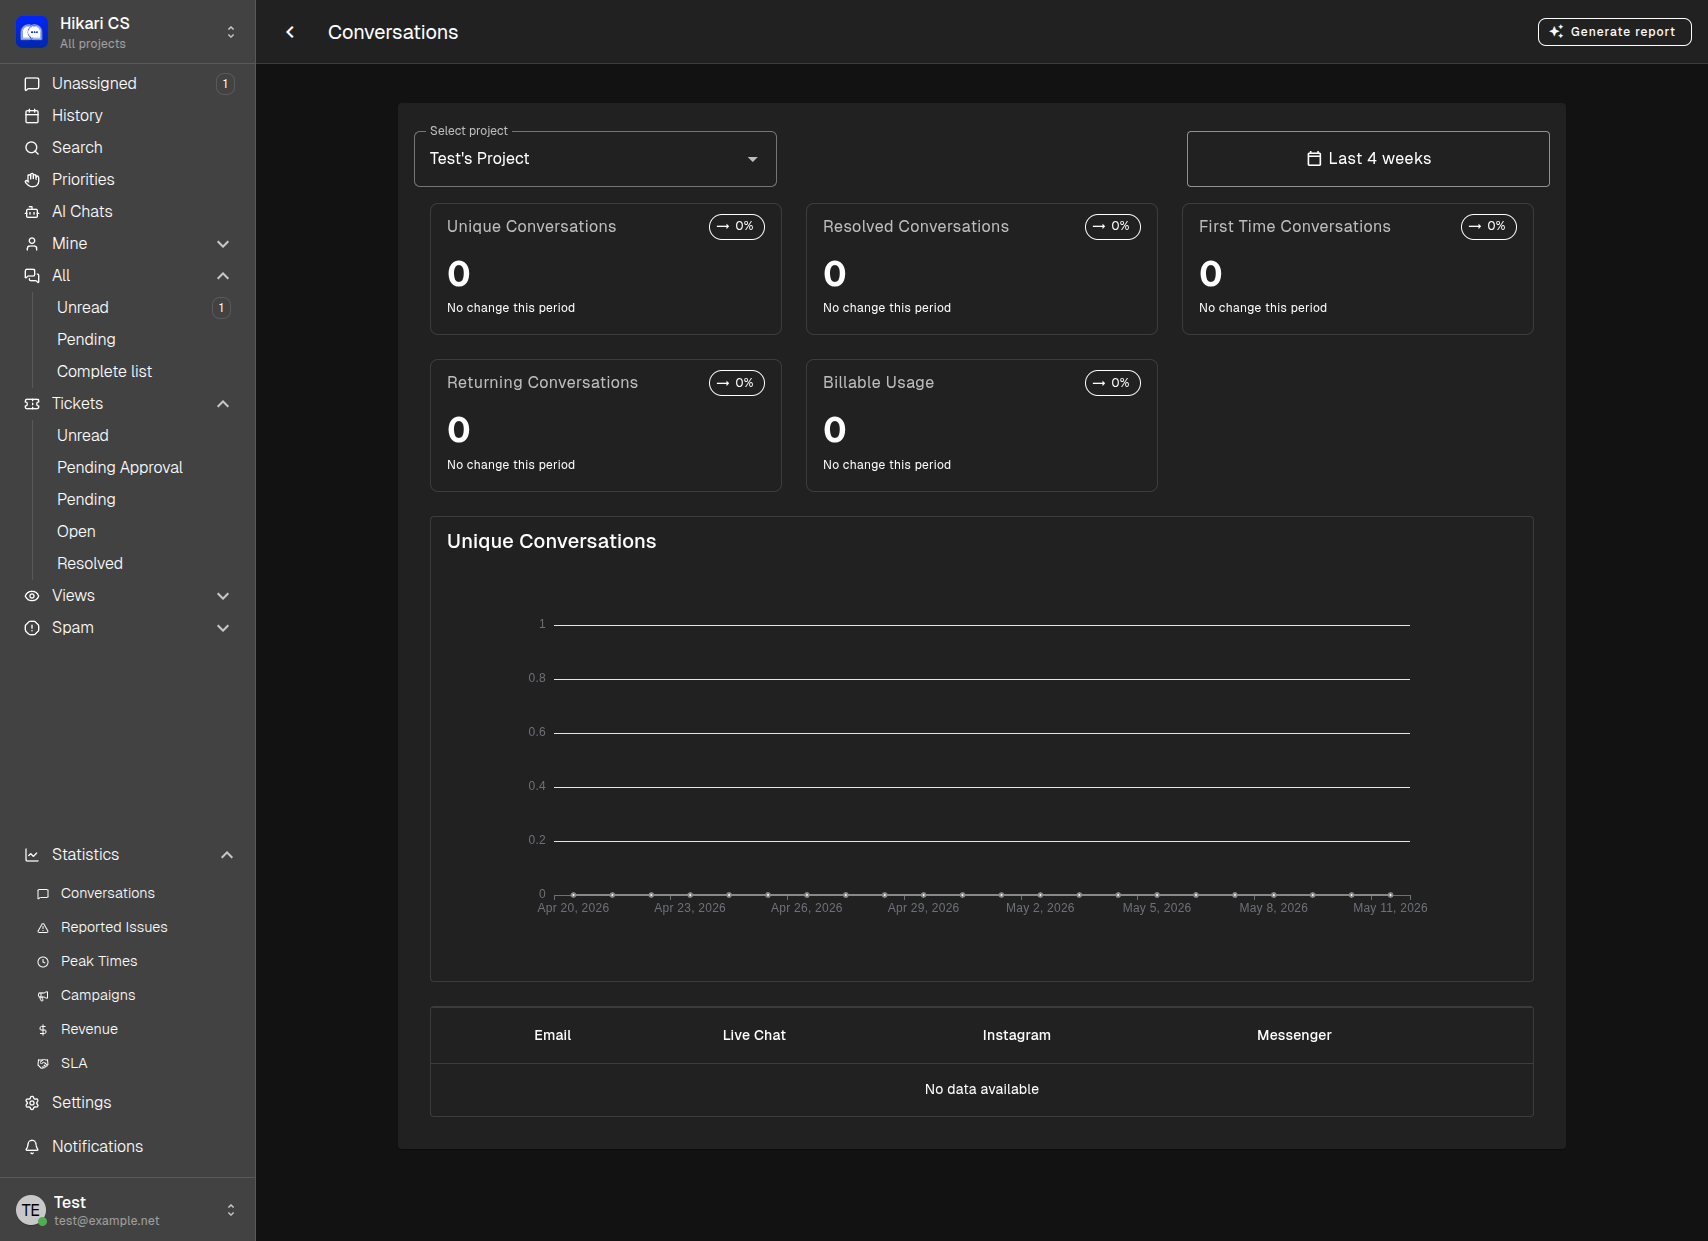
The Conversations dashboard provides an overview of your support activity:
Key Metrics
| Metric | Description |
|---|---|
| Unique Conversations | Total distinct conversation threads in the selected period |
| Resolved Conversations | How many conversations were successfully closed |
| First Time Conversations | New customers reaching out for the first time |
| Returning Conversations | Follow-up messages from existing customers |
| Billable Usage | Conversation count applied toward your billing |
Channel Breakdown
View conversation distribution across channels:
- Live Chat
- Messenger
Use the project selector and date range filter to narrow down your analysis.
Reported Issues Statistics
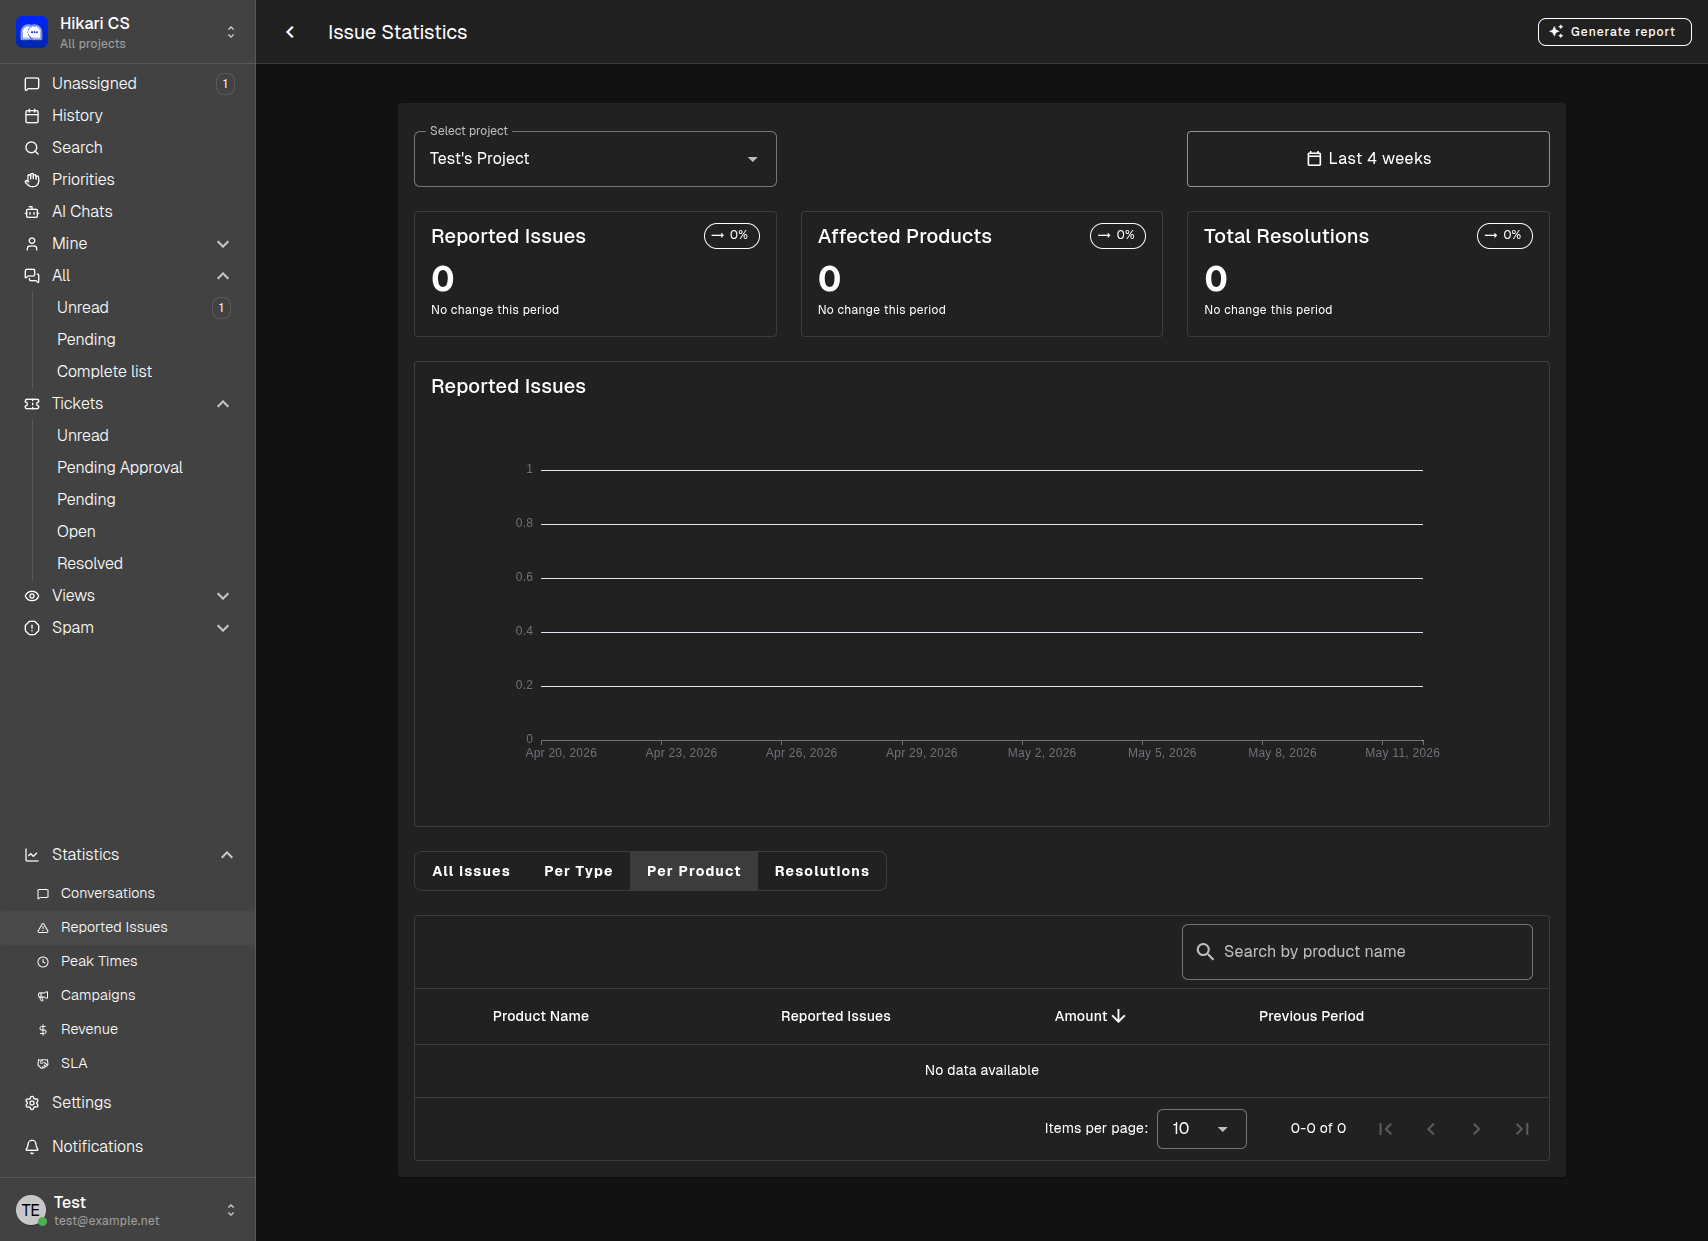
Track product and service issues over time:
Metrics
| Metric | Description |
|---|---|
| Reported Issues | Total issues logged by customers |
| Affected Products | How many different products had reported issues |
| Total Resolutions | Issues that have been resolved |
Views
Switch between different perspectives:
- All Issues — Complete list of reported issues
- Per Type — Issues grouped by category (e.g., shipping, product defect)
- Per Product — Issues broken down by individual product
- Resolutions — How issues were resolved (refund, replacement, etc.)
Search by product name and use pagination to browse large datasets.
Peak Times Statistics
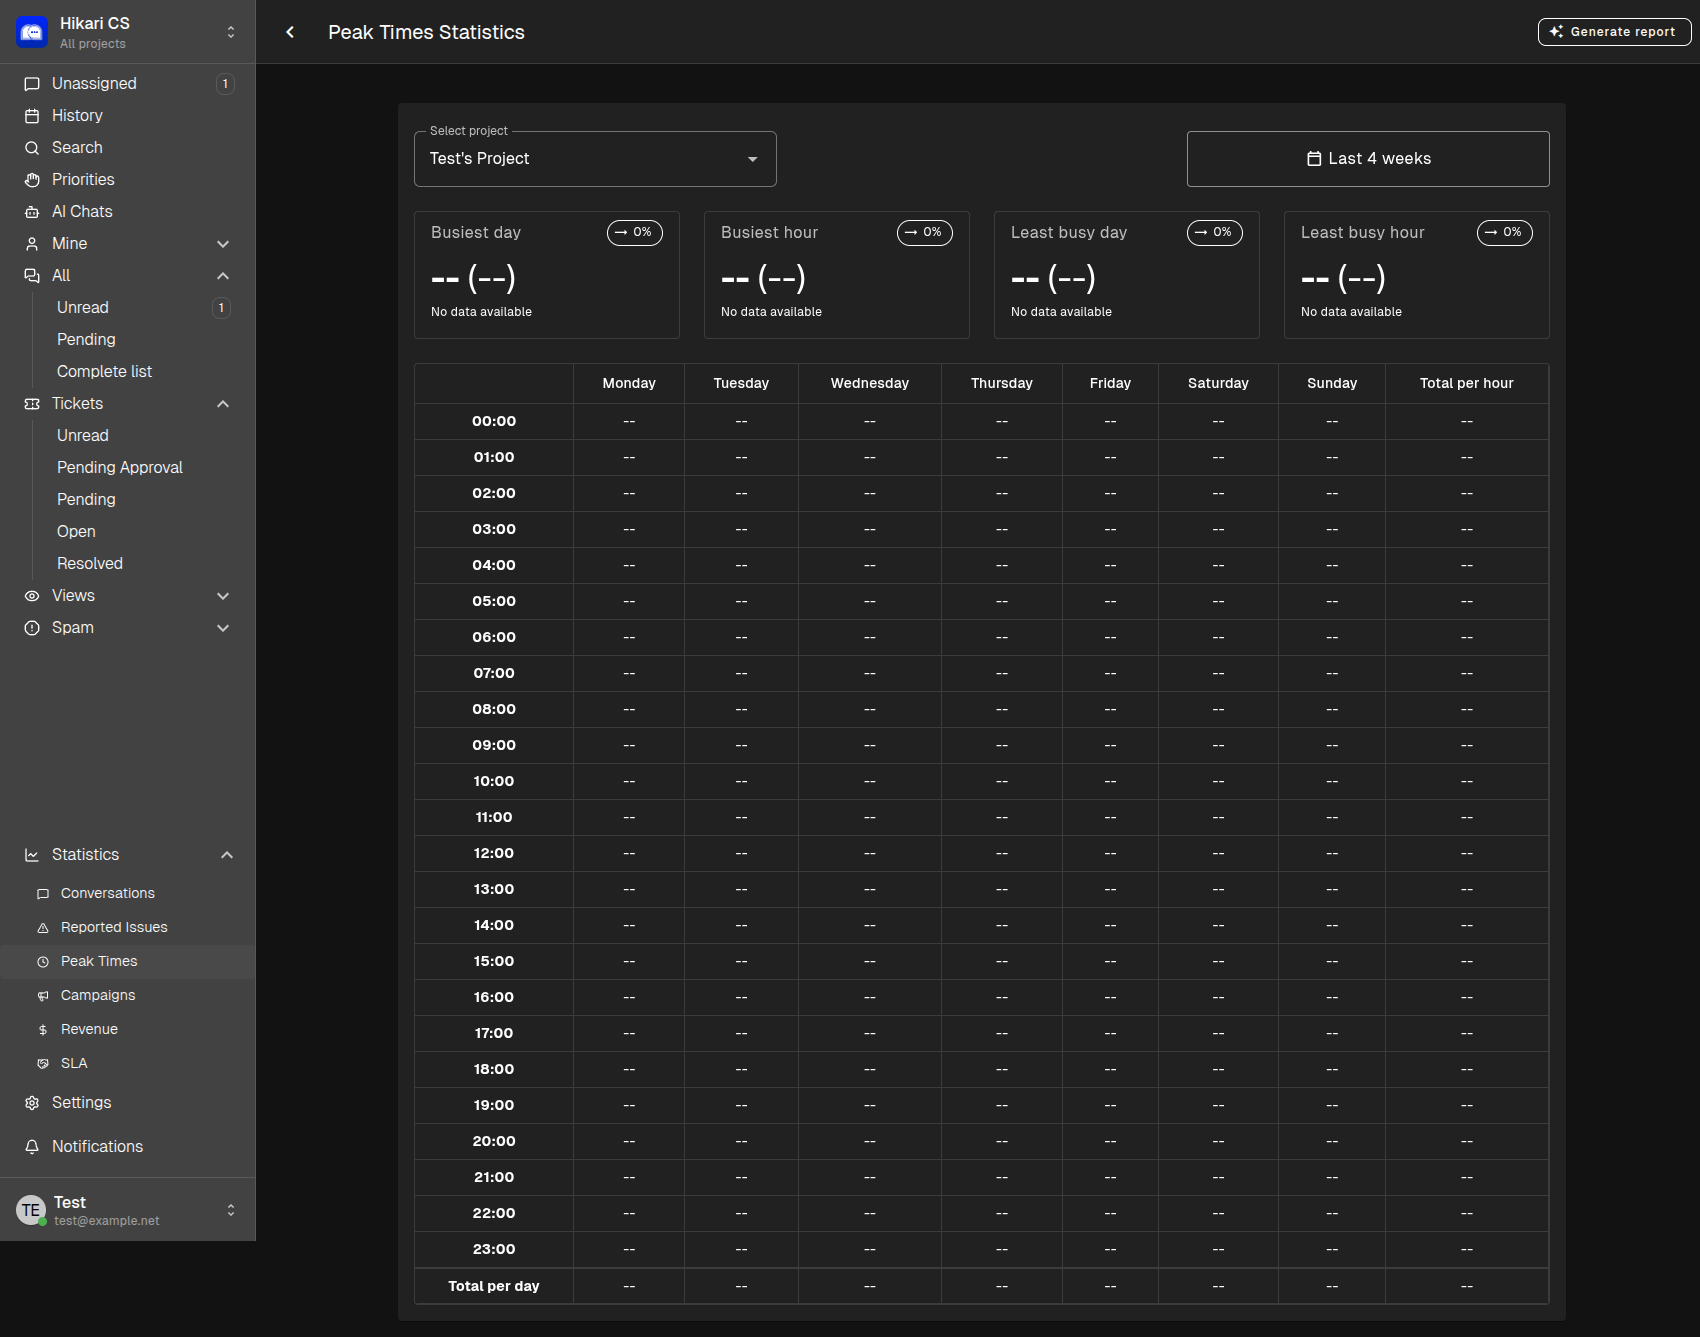
Understanding when your customers are most active helps you schedule staff effectively:
Summary Cards
| Metric | Description |
|---|---|
| Busiest day | The day of the week with the most conversations |
| Busiest hour | The time of day with the highest message volume |
| Least busy day | The quietest day for support |
| Least busy hour | The time when fewest messages arrive |
Hourly Heatmap
The detailed table shows conversation volume broken down by:
- Rows — Hours of the day (00:00 to 23:00)
- Columns — Days of the week (Monday through Sunday)
- Totals — Daily and hourly sums at the bottom and right edges
Use this data to optimize your team’s work schedule templates and ensure coverage during busy periods.
Generating Reports
Every statistics page includes a Generate report button. Use this to export your data for presentations, stakeholder updates, or offline analysis.
Tips for Using Statistics
- Check trends weekly — Regular review helps you spot patterns before they become problems
- Compare periods — Use date range filters to compare this month vs. last month
- Align staffing with Peak Times — Schedule more agents during your busiest hours
- Track issue resolution rates — Low resolution rates may indicate process or product problems